Closed-Form Thermodynamic Inversion of the ICAO Standard Atmosphere (Doc 7488) and Quantitative Divergence Bounds of Flight-Training Density Altitude Heuristics
1. Abstract
Density altitude (hDA) is a foundational thermodynamic parameter in aeronautical engineering and flight operations, defining the altitude in the standard atmosphere at which ambient air density matches local air density. A commonly taught flight-training approximation expresses density altitude via the linear rule-of-thumb: hDA ≈ hPA + 120 × (Tactual − TISA). While practical for rapid cockpit mental estimation, this linear heuristic lacks a rigorous analytical presentation in standard pilot literature and departs from the non-linear physics of the International Civil Aviation Organization (ICAO) Standard Atmosphere (Doc 7488/3).
This monograph presents a closed-form thermodynamic inversion of the standard troposphere: hDA = (T0 / L) [ 1 − (ρ / ρ0)1 / (κ − 1) ] = 145,366.45 × [ 1 − (ρ / ρ0)0.234969 ] ft (exact within the stated standard-atmosphere mathematical model and assumptions). We establish the formal mathematical origin of the 120 ft/°C heuristic by conducting a first-order Taylor series expansion about the standard sea-level datum, demonstrating that the theoretical first-order derivative is ∂hDA / ∂T = 118.54 ft/°C (approximated historically as 118.8 ft/°C and rounded to 120 ft/°C for mental math).
Across a high-density 6,885-point computational matrix (−1,000 ft to +20,000 ft, −30°C to +50°C), we evaluate airport case studies including Leadville, CO (KLXV), Death Valley, CA (L06), and Phoenix, AZ (KPHX), demonstrating heuristic divergences ranging from +249 ft to +311 ft under extreme summer conditions. All benchmark data and calculation routines are published under open science identifiers.
Research at a Glance (Key Technical Findings)
EXECUTIVE BRIEFThe exact algebraic closed-form inverse equation for density altitude in the ICAO Doc 7488 constant-lapse troposphere: hDA = 145,366.45 × [1 − σ0.234969] ft.
The standard flight-training linear rule-of-thumb: hDA ≈ hPA + 120 × ΔISA. Proven to be the first-order Taylor expansion evaluated at standard sea level (exact derivative: 118.54 ft/°C).
A 6,885-point discrete computational grid spanning pressure altitudes from −1,000 ft to +20,000 ft (250-ft steps) and outside air temperatures from −30°C to +50°C (1°C steps). Published under Figshare DOI 10.6084/m9.figshare.34059369.
Global Mean Absolute Error (MAE) across the 6,885 points is 243.20 ft. In typical high-elevation summer departures (ΔISA ≥ +25°C), the linear rule overestimates density altitude by +240 ft to +320 ft (e.g. +264 ft at Leadville, +311 ft at Death Valley).
2. Nomenclature & Physical Constants
| Symbol | Definition | SI Unit | Aviation Unit | Standard Sea Level Value |
|---|---|---|---|---|
| hPA | Pressure altitude | m | ft | Altitude where P(h) = P_ambient |
| hDA | Density altitude | m | ft | Altitude where ρ_std(h) = ρ_ambient |
| P0 | Standard sea-level static pressure | Pa (N/m²) | inHg / hPa | 101,325.0 Pa (29.9213 inHg / 1013.25 hPa) |
| T0 | Standard sea-level temperature | K | °C / °F | 288.15 K (+15.0°C / 59.0°F) |
| ρ0 | Standard sea-level air density | kg/m³ | slug/ft³ | 1.22500 kg/m³ (0.0023769 slug/ft³) |
| R | Specific gas constant for dry air | J/(kg·K) | ft·lbf/(slug·°R) | 287.05287 J/(kg·K) |
| L | Tropospheric temperature lapse rate | K/m | °C/1,000 ft | 0.0065 K/m = 0.0019812 K/ft (1.9812°C/1,000 ft) |
| κ | Barometric pressure exponent (g₀ / (RL)) | — | — | 5.2558797 ≈ 5.25588 |
| T0 / L | Tropospheric scale height constant | m | ft | 44,330.77 m = 145,366.45 ft |
3. Governing Thermodynamic Equations (ICAO Doc 7488)
The International Standard Atmosphere (ICAO Doc 7488/3) and U.S. Standard Atmosphere (1976) model the lower atmosphere (troposphere, 0 ≤ H ≤ 11,000 m / 36,089.24 ft) under hydrostatic equilibrium and ideal gas behavior:
P = ρ · R · T ⇒ ρ = P / (R · T)
Balancing vertical pressure gradients directly against gravitational body forces in dry air.
P(H) = P₀ · [ 1 − (L · H / T₀) ]^5.25588
Integrating the hydrostatic differential equation across the constant lapse rate troposphere (L = 0.0019812 K/ft).
4. Closed-Form Density-Altitude Inversion & Taylor Series Origin
hDA = 145,366.45 · [ 1 − σ^(0.234969) ] [ft]
Derived directly from equating ambient air density ρ with standard density profile ρstd(h). Exact within the stated standard-atmosphere mathematical model and assumptions.
= 1 / [ 0.0019812 · 4.25588 ] = 118.54 ft/°C
Proves that 118.54 ft/°C (approximated historically as 118.8 ft/°C and rounded to 120 ft/°C for mental math) is the exact first-order derivative at standard sea level.
5. Publication Figures & Error Matrix Analysis
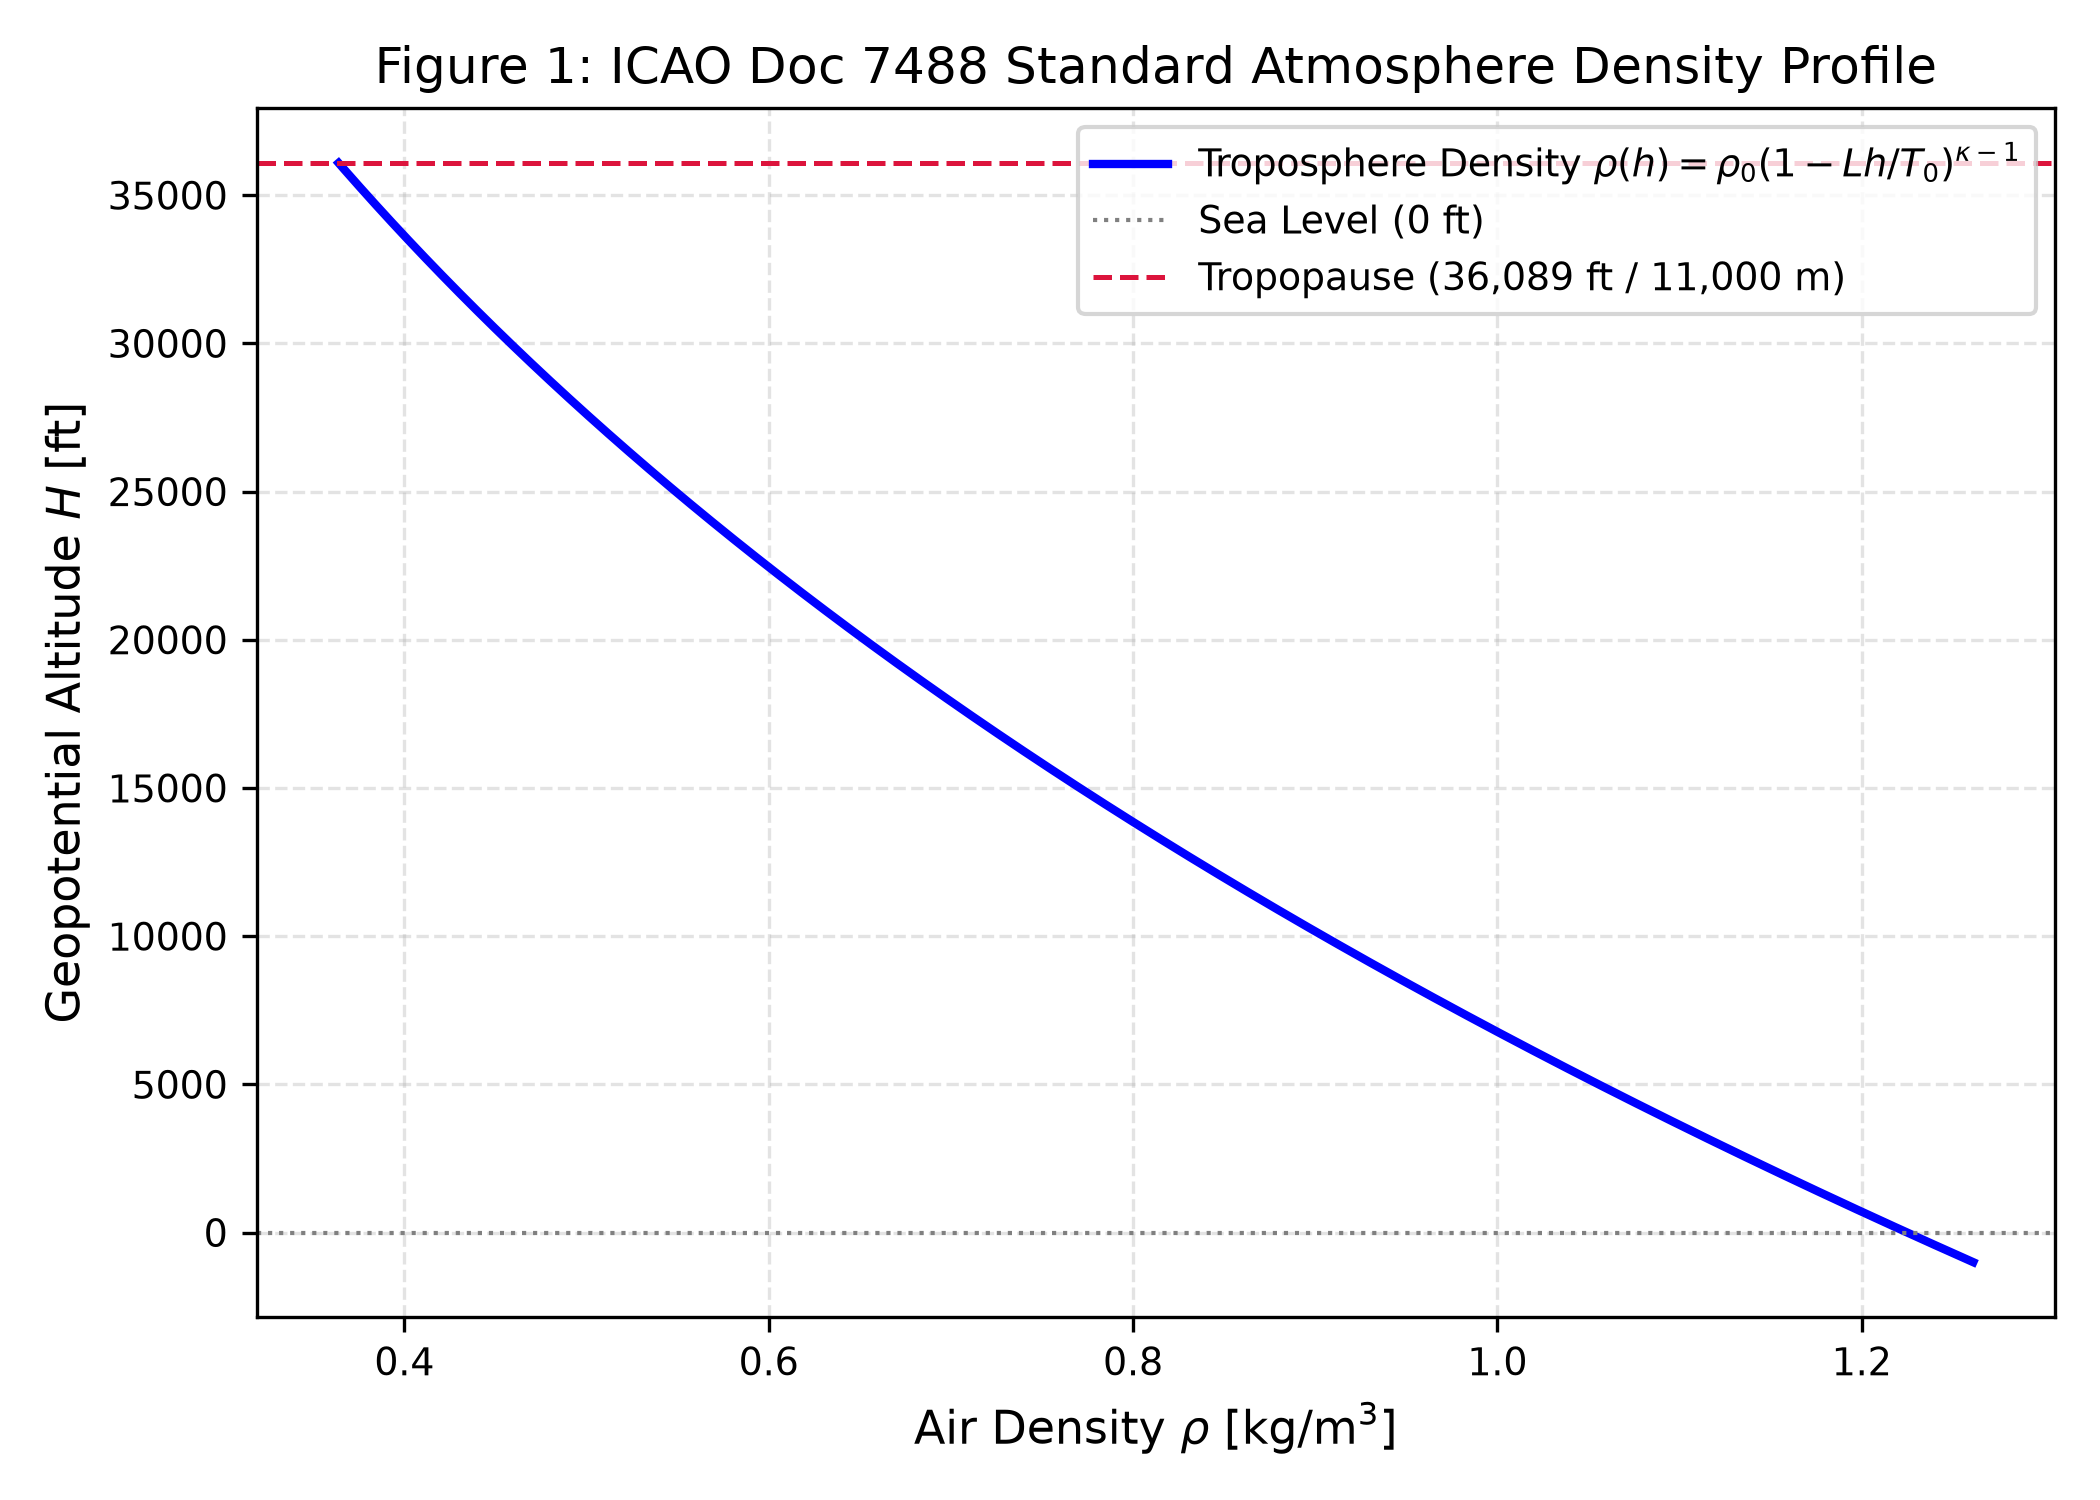
Vertical mass density variation ρ(H) up to the 36,089 ft tropopause boundary.
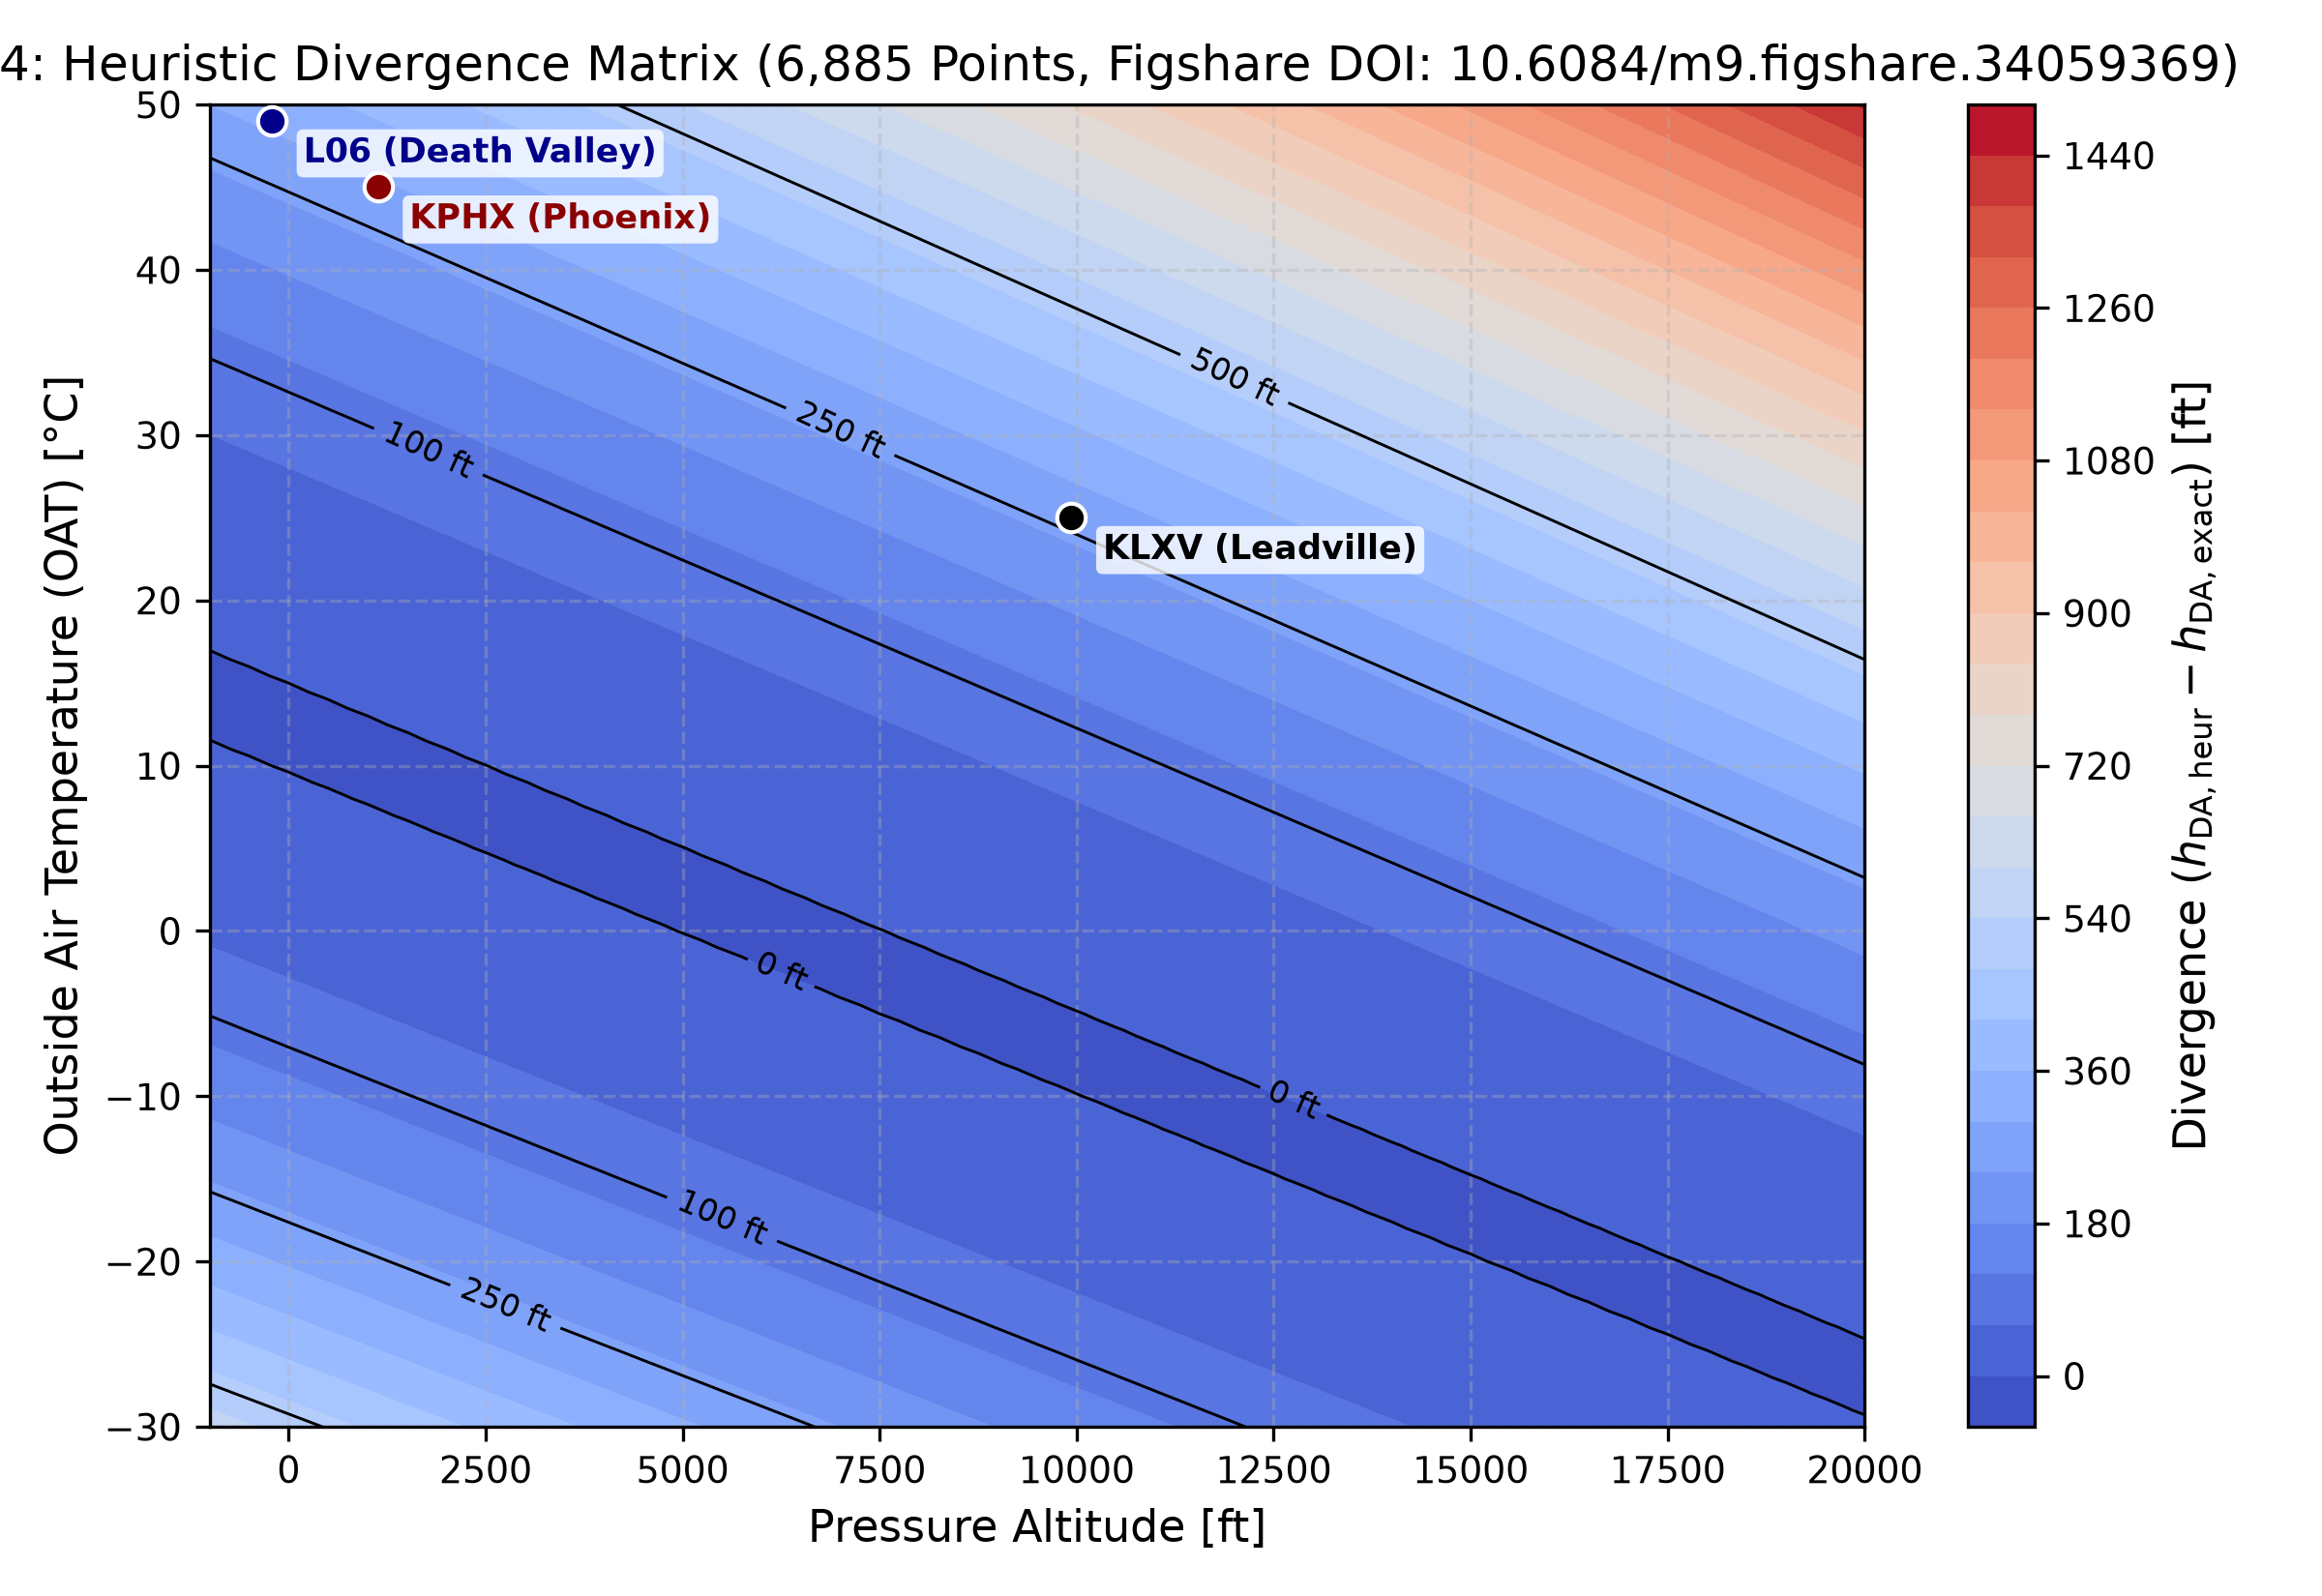
Heuristic divergence mapping across altitude (−1,000 to +20,000 ft) and OAT (−30 to +50°C).
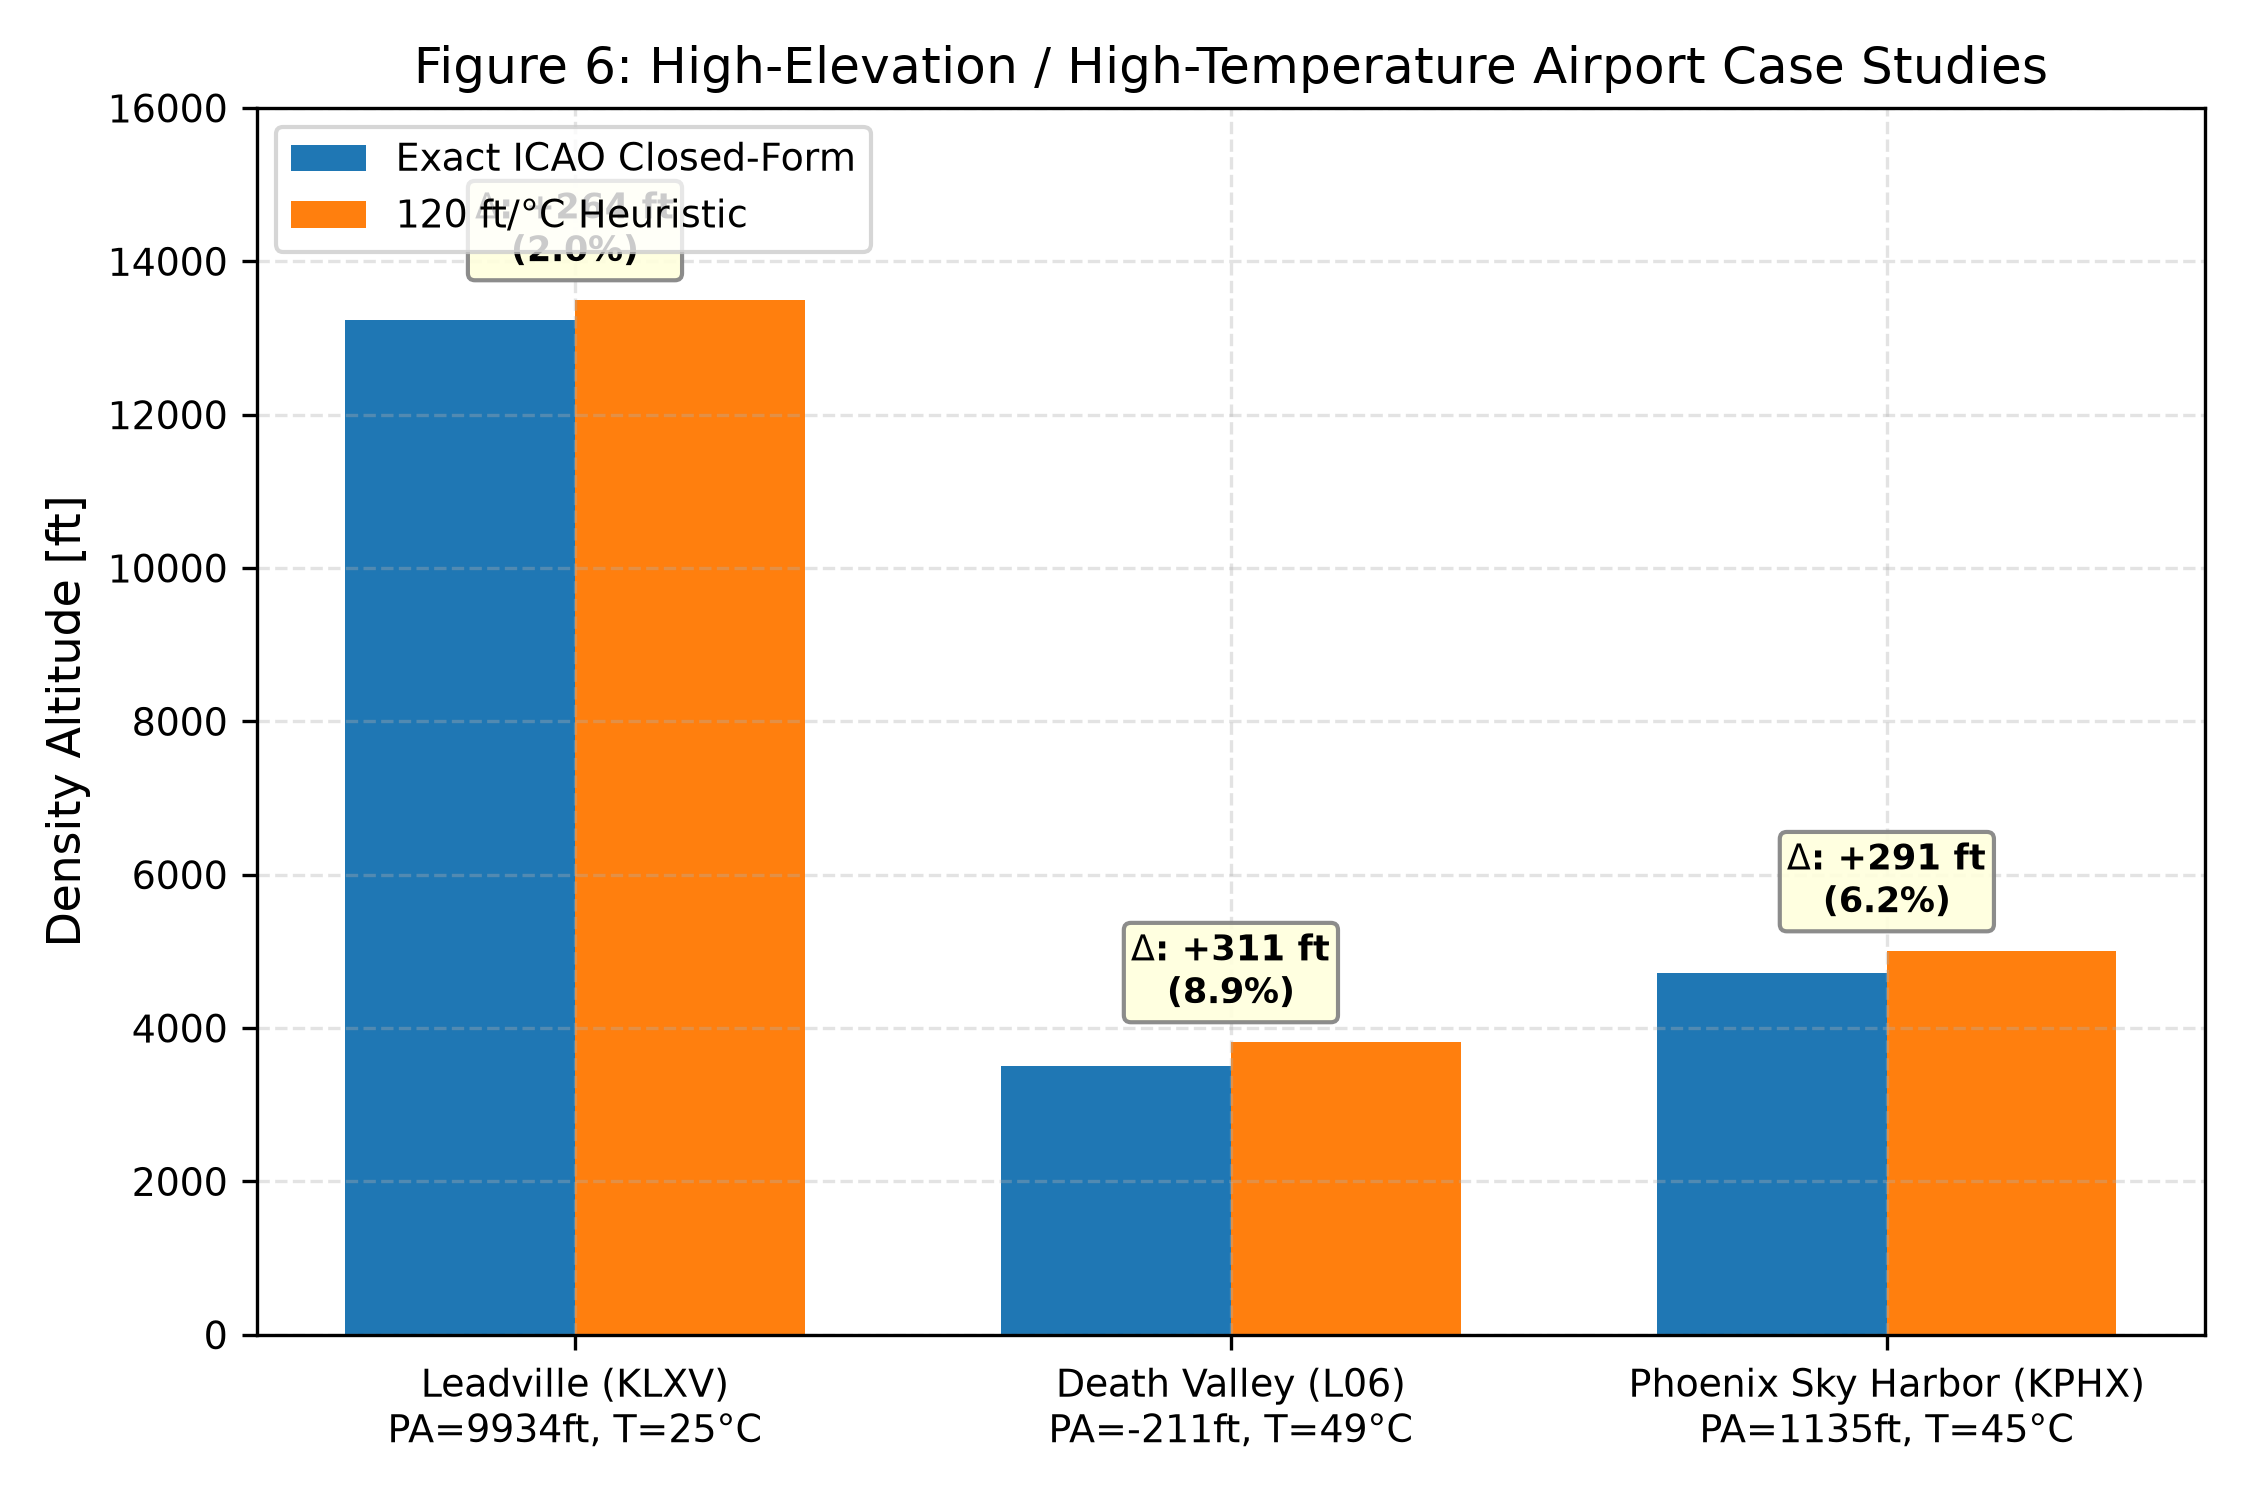
Leadville (KLXV), Death Valley (L06), and Phoenix (KPHX) divergence comparisons.
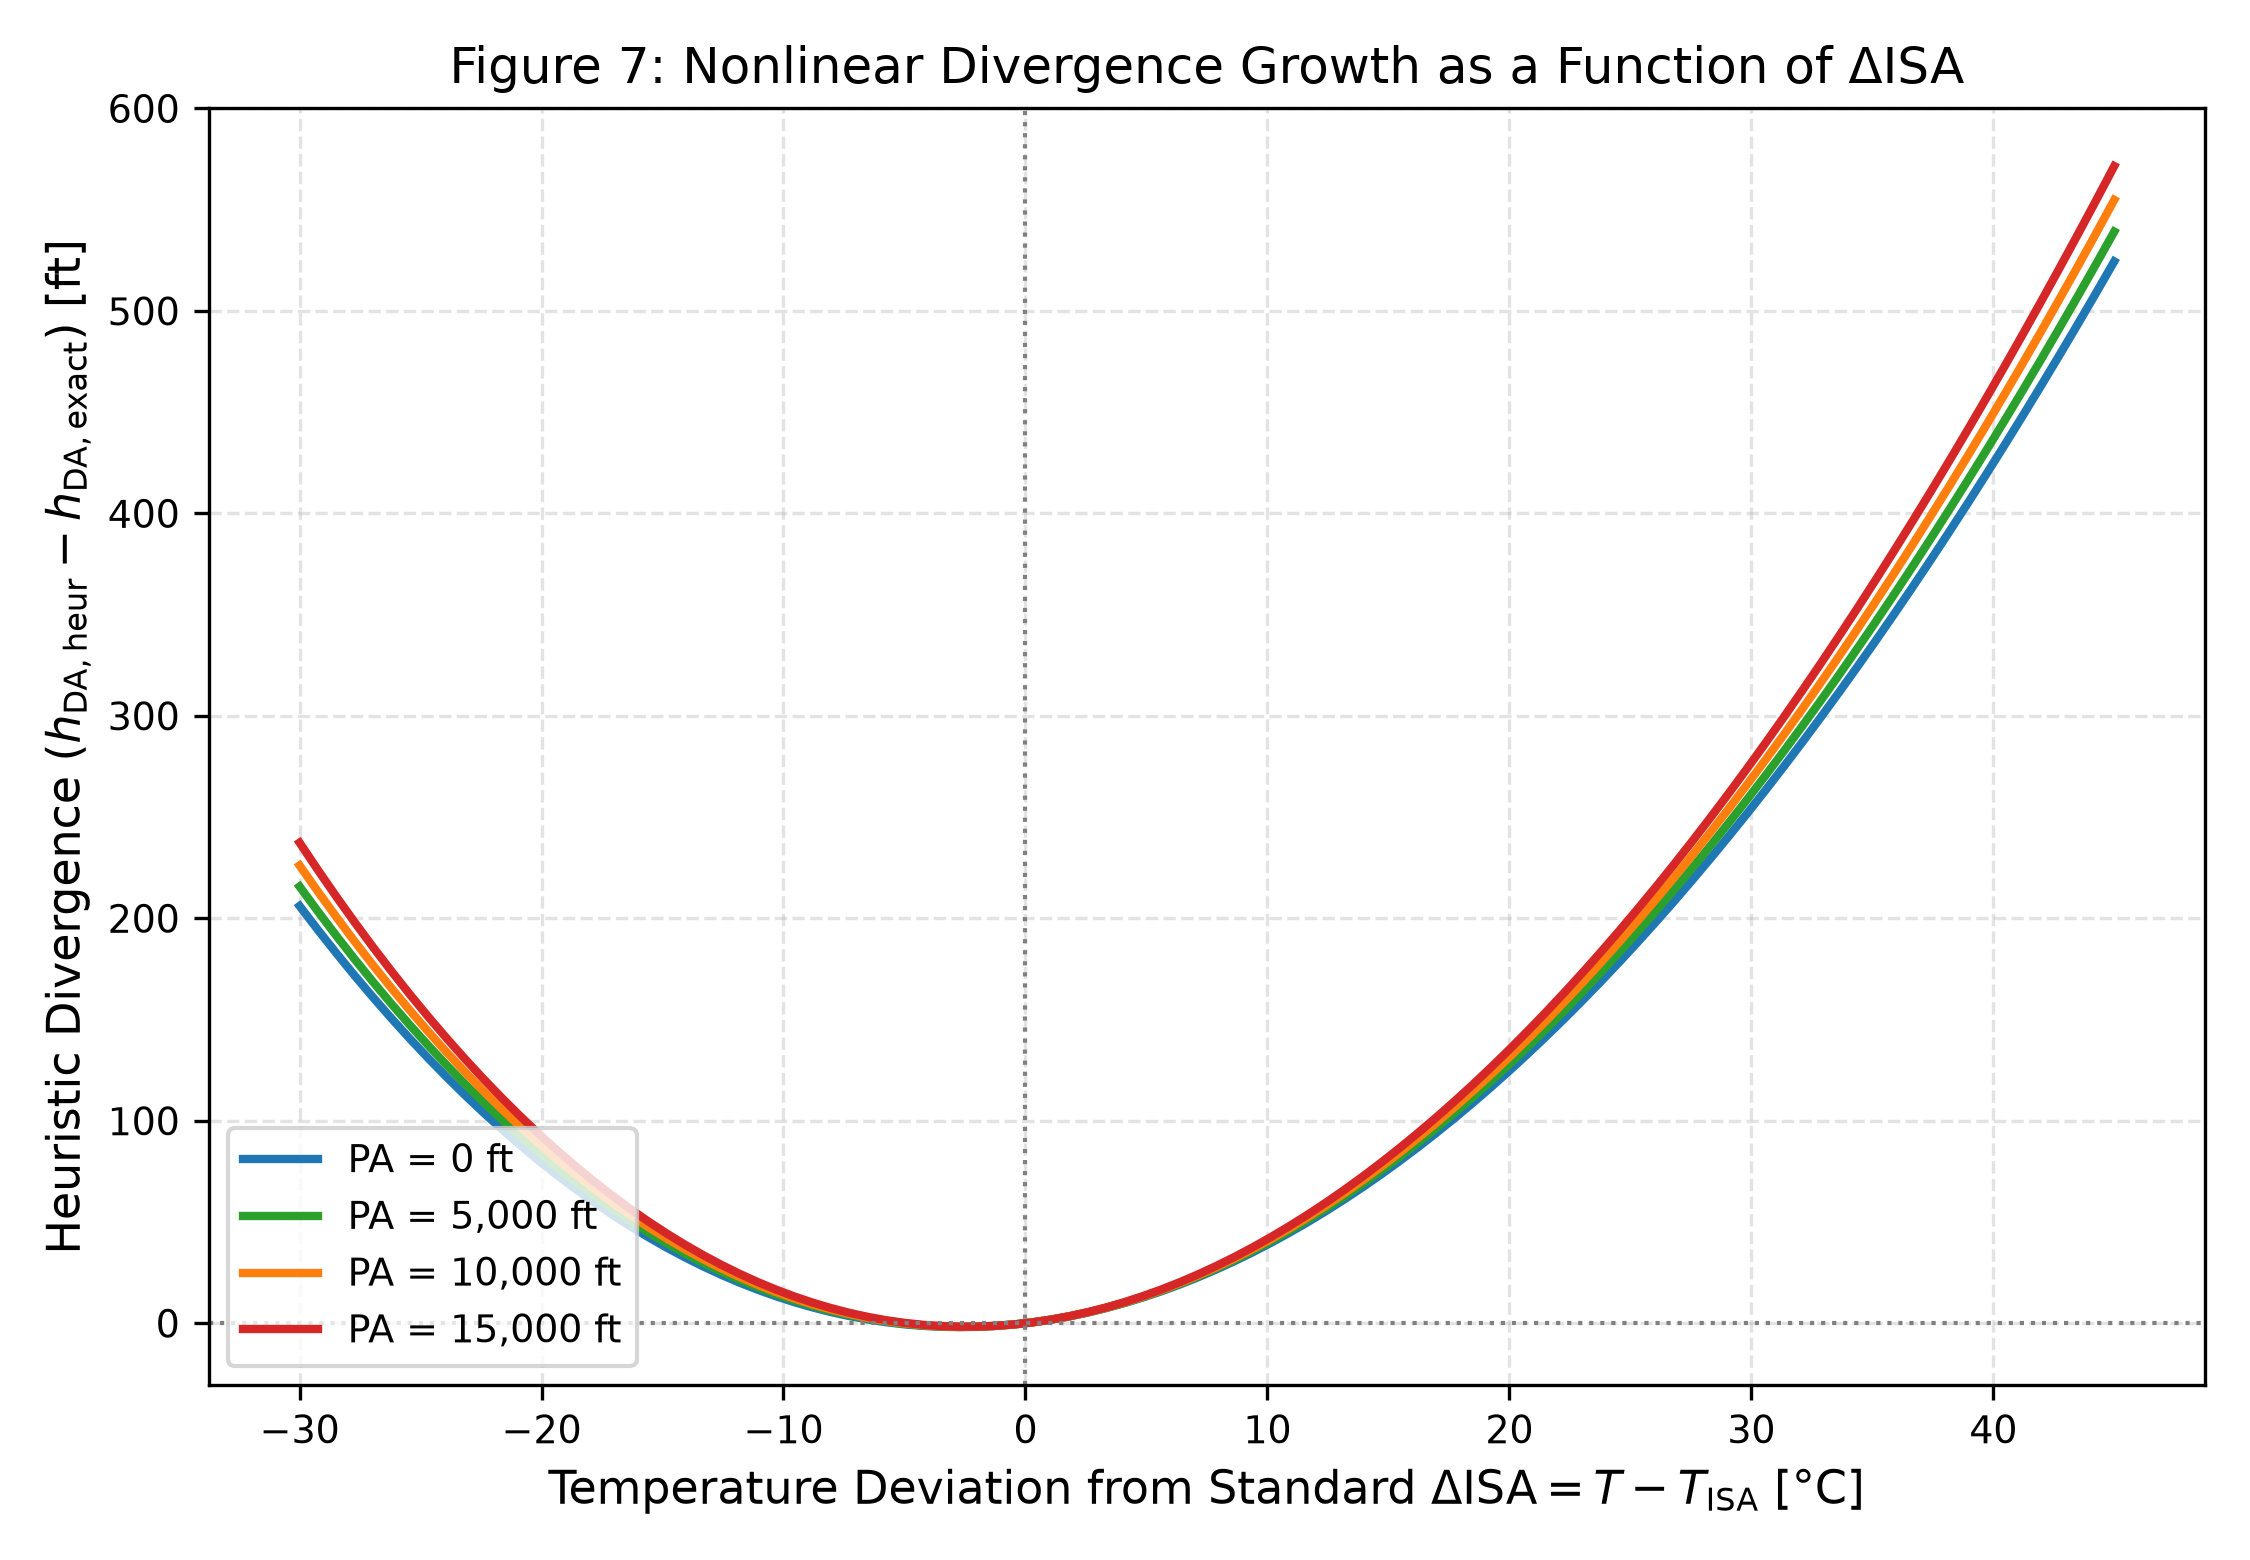
Non-linear departure acceleration as temperature deviates from standard atmosphere.
6. Airport Case Studies Verification Matrix
| Airport Identifier | Elevation (PA) | OAT | ISA Dev | Exact ICAO DA | 120 ft/°C Heuristic | Divergence | Rel. Error |
|---|---|---|---|---|---|---|---|
| Leadville Lake County (KLXV) | 9,934 ft | +25.0°C | +29.68°C | 13,232 ft | 13,496 ft | +264 ft | +1.99% |
| Death Valley Furnace Creek (L06) | −211 ft | +49.0°C | +33.58°C | 3,508 ft | 3,819 ft | +311 ft | +8.85% |
| Phoenix Sky Harbor (KPHX) | 1,135 ft | +45.0°C | +32.25°C | 4,714 ft | 5,005 ft | +291 ft | +6.17% |
Note: Divergence is defined as (hDA,heur − hDA,exact). Calculations assume dry air at standard barometric baseline (29.92 inHg).
7. Aerodynamic & Engine Performance Implications
Dynamic pressure q = ½ρV² governs lift and drag. True Airspeed scales analytically with density ratio: VTAS = VIAS / √σ. At Leadville (σ = 0.6664), true liftoff speed is +22.5% higher.
Naturally aspirated piston engines follow the Gagg & Farrar model: BHP ≈ BHP₀ · [(σ − 0.117) / 0.883], losing ~3% to 4% brake horsepower per 1,000 ft of density altitude increase.
Takeoff ground roll scales approximately with Sg ∝ 1 / σ². At Leadville, ground roll increases by approximately +125% relative to sea-level standard conditions.
8. Limitations & Model Assumptions
- Troposphere Ceiling: Valid within the constant temperature lapse rate troposphere (0 to 36,089 ft / 11,000 m). Does not apply to the isothermal stratosphere.
- Dry Air Baseline: Calculations model clean, dry air (R = 287.05287 J/(kg·K)). High atmospheric humidity reduces air density further, adding an effective +100 ft to +500 ft of density altitude.
- POH/AFM Precedence: Aerodynamic scaling relationships are physical approximations. Flight planning must always verify aircraft-specific limitations in the FAA-approved Airplane Flight Manual (AFM) or Pilot's Operating Handbook (POH).
9. Technical Questions & Search Intent FAQ
What is the exact mathematical formula for density altitude?▼
In the ICAO Standard Atmosphere troposphere, density altitude is solved by inverting the vertical mass density profile:
Where ρ is ambient air density derived from the ideal gas law (ρ = P / (R·T)), ρ₀ = 1.22500 kg/m³, T₀ = 288.15 K, and L = 0.0019812 K/ft.
Where does the 120 ft/°C flight-training rule of thumb come from?▼
The 120 ft/°C multiplier represents the first-order partial derivative of density altitude with respect to temperature (∂hDA/∂T) evaluated at standard sea level (0 ft PA, 15°C). The theoretical analytical derivative evaluates to 118.54 ft/°C, which was historically cited as 118.8 ft/°C in ground schools and rounded to 120 ft/°C for cockpit mental math.
Why does the 120 ft/°C approximation diverge at high altitudes and temperatures?▼
Because the true atmospheric density relation is a non-linear power-law function rather than a straight line. As temperature and elevation increase, the local derivative ∂hDA/∂T decreases. Applying a fixed linear slope of 120 ft/°C causes the heuristic to overestimate true density altitude by +240 ft to +320 ft under hot summer mountain conditions.
What is the difference between pressure altitude and density altitude?▼
Pressure altitude is the height above the standard 29.92 inHg (1013.25 hPa) barometric plane. Density altitude is pressure altitude corrected for non-standard outside air temperature. In hot weather, density altitude is significantly higher than pressure altitude; in extreme cold, density altitude is lower than pressure altitude.
10. Academic Citation & Open Reproducibility
Please cite this monograph and its companion computational benchmark when using these closed-form formulations in academic coursework, flight simulation models, or avionics software:
@article{aeroway_density_altitude_monograph_2026,
  author    = {Miad S.},
  title     = {{Closed-Form Thermodynamic Inversion of the ICAO Standard Atmosphere (Doc 7488) and Quantitative Divergence Bounds of Flight-Training Density Altitude Heuristics}},
  journal   = {Aeroway Aeronautical Research Monograph Series},
  volume    = {Doc AER-2026-01},
  year      = {2026},
  month     = oct,
  publisher = {Aeroway Flight Engineering},
  doi       = {10.6084/m9.figshare.34059369},
  url       = {https://aeroway.org/research/closed-form-density-altitude-monograph/}
}
Connected Aeronautical Reference Knowledge Graph
TOPICAL CLUSTERInteractive cockpit solver with humidity adjustments & Koch chart fits.
Engineering breakdown of hydrostatic lapse rates & model explorer.
Open-access CSV dataset matrix under CC BY 4.0 on Figshare.
Dynamic sandbox comparing closed-form inversion vs heuristic errors.